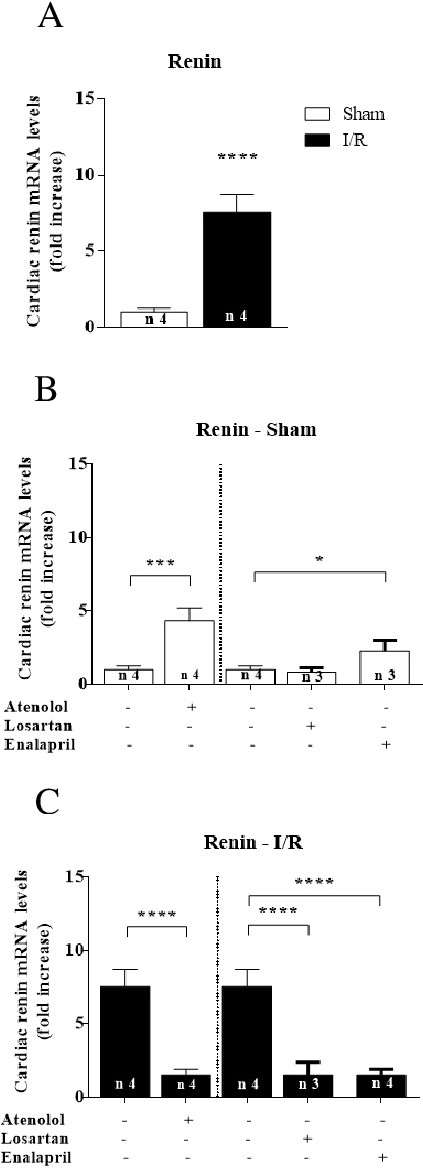
Fig. 8. Renin mRNA levels in the heart tissue after renal I/R. Data are expressed as mean ± SD. The number of experiments using different preparations is indicated within or above each bar. Mice from Sham (empty bars) and I/R (filled bars) groups were treated with or without different drugs, as indicated on the abscissae. (A) Comparison of cardiac renin mRNA levels between Sham and I/R mice. Means were compared using Student's t-test; ****p<0.0001. (B) Effect of SNS and RAS blockade on cardiac renin mRNA level from Sham mice. Left side: atenolol; ***p<0.001, as assessed using Student's t-test. Right side: losartan or enalapril, as indicated on the abscissa; *p<0.05, as assessed using one-factor ANOVA followed by Bonferroni's test for selected pairs. (C) Effect of blockade of SNS and RAS on cardiac renin mRNA level in I/R mice. Left side: Atenolol; ****p<0.0001, as assessed using Student's t-test. Right side: Losartan or enalapril, as indicated on the abscissa; ****p<0.0001, as assessed using one-factor ANOVA followed by Bonferroni's test for selected pairs.